SELECTED RELEVANT PROJECTS
PROJECT 1 (Graduate Research Experience)
“Multi-Method Machine Learning Model for Retail Stores Operations Control; using Microsoft Azure Machine Learning Studio”
Description;
I developed an interface using historical operations dataset to construct a combined model that utilized three different regression techniques; Boosted Decision Tree Regression, Linear Regression and Decision Forest Regression.
My model used a segregated dataset that combine ABC product analysis and moving average data. The three models were trained utilizing a randomized technique considering 70% of the total of records. Finally the three results of the trained models were scored and converted into a CSV file to test mean absolute values and data normalization results. The model can be adapted to various retail type industries for operational inventory controls. This was tested used Walmart & Sam’s Club real-data.
The tools used were: Azure Microsoft Machine Learning Studio, Excel, Tableau
Multi-Method Machine Learning Model
Boosted Decision Tree, Linear and Decision Forest Regression
PROJECT 2 (Graduate Research Experience)
“A Spatial Analysis Tool to Model Food Deserts in Savannah, Georgia”
Description;
Link: https://arcg.is/DmKmv
I developed a spatial analysis tool to model food desert areas in Savannah, Georgia. I used exploratory spatial data with a spatial Point Pattern Analysis (PPA) modeling, including official census demographic data, business location of convenience stores, and Savannah’s grocery stores. My project demonstrated and determined food desert areas by analyzing convenience stores’ spatial location versus grocery stores. Having discovered a direct relation between low-income, high poverty, and high unemployment areas, I found that food desert areas may affect such population’s diet, contributing to a high-caloric food intake that leads to adverse health effects.
The tools used were: ArcGIS Pro, R Studio, CRAN, SpatStat.
PROJECT 3 (Graduate Research Experience)
“Transportation and Logistics Command Center, Coggin College of Business, Transportation and Logistics Flagship Program”
Description;
Link: https://pine-pound-287.notion.site/533c55ada9274bb298a4541646c8e0b9?v=1cf2e0e3efae4c269a38ed525a18ffb7
Designed and developed a command center tool that incorporate multiple transportation, logistics and supply chain management related capabilities. For instance, Rail transportations dashboard network systems and data records, air and maritime tools for real-time tracking visibility in the U.S. with major vendors. Real time data tables and statistics from the Transportation of Bureau of Statistics. Business intelligence tools and dashboard capabilities.
The tools used were: ArcGIS Pro, Power BI, Notion,
PROJECT 4 (Graduate Research Experience)
“Coastal Logistics Conservation Project for Turtle Nesting in Atlantic Beach, FL.”
Description;
Link: https://arcg.is/00myWK
On this project, I created a spatial fishnet area of study for a nesting turtles protection project in Atlantic Beach area through ArcGIS with an integrated 3D Google Earth Tour.
The tools used were: ArcGIS Pro, GoogleEarth
Coastal Logistic
Coastal Logistic
Project Spatial Location
Turtle Nest Area
PROJECT 5 (Professional Work Experience)
Data-Driven Dashboards, KPI’s, and Reporting Tool
Description;
While working at Crowley Maritime as business analysis developed two main dashboards tools as described;
- Data-Driven KPI’s Dashboard, this dashboard provided visibility to upper management to all the orders/loads that were created in the transportation management system and depicted by business unit its revenue impact, by month and by customer versus top customers through the Pareto principle; where ~20% of customers represent ~80% of revenue value [$].
- Operations on-demand reporting; I created and designed several reporting tools that provided to the U.S. brokerage transportation and operations teams on-demand reports aiming to solve day to day relevant issues as, order placement and execution issues
The tools used were: Microsoft Power BI and On-premises tool, Tableau, MySQL Studio, Oracle Business Intelligence
Continuous Business Process Improvement
Cross-Functional Business Process Mapping
Revenue KPIs
Settlement Management
Reporting Tools
PROJECT 6 (Professional Work Experience)
“Emergency Response & Relief Program Manager”
Description;
Directed the logistics of an Emergency Response program in the Island of Puerto Rico after the hit of hurricane Irma and Maria in 2017. Supported the Federal Emergency Response Agency FEMA and the United States Army Corps of Engineers USACE on the logistics and supply chain strategy execution of receiving, handling and transportation of containers with relief during the catastrophe event. Similarly, to guarantee the payment execution of >$75 millions in third-party vendor payments. Managed the vendor contracting project and supply chain management flow during the electrification project by ensuring logistics capabilities to received > 80,000 concrete, metal and wood poles to reconstruct the electricity network system in the island of Puerto Rico;
The tools used were: Microsoft Power BI, SAP, Oracle Business Intelligence, Microsoft Excel, Transportation Management System TMW, Tableau.
Food Logistic Distribution
Humanitarian Relief Logistics & Supply Chain Management
Humanitarian Logistics
PROJECT 7 (Professional Work Experience)
“Implementation of a New ERP Sytem from System Applications Products in Data Processing (SAP) to Oracle Business Intelligence (OBI)”
Description;
Supported the implementation and transition from SAP to OBI finance, procurement, transportation management system, accounting, sales modules. ;
The tools used were: Microsoft Power BI, SAP, Oracle Business Intelligence, Microsoft Excel, Transportation Management System TMW, Tableau.
Business Process Mapping
Kaizen - Continuous Process Improvement
Information System Business Implementation
PROJECT 8 (Academic Research )
Automated System; LOGO-Controlled Filling; Programmable Logic Controller
Description;
During my Technical high school degree in Electronic, developed a prototype which provides an automated controlled filling system through color and size sensors, intended applications for automated manufacturing systems.
The tools used were: PIC8F4450 Microchip programmable, Color Sensor Programmable TCS320 Light Sensing ICA sensor of color, a Programmable Logic Controler (PLC)
Flowchart Process
TCS320 Color Sensor Programmable
PIC Programmable
PROJECT 9 (Graduate Research)
Earthquake Pattern-Evaluation Model
Description;
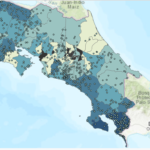
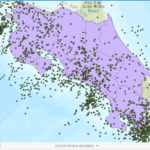
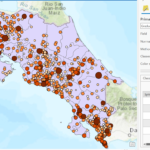
Designed a model that estimates earthquakes in Costa Rica based on records of ~30 years of earthquakes in Costa Rica. This tool evaluates risks based on the amount, magnitude, and location of earthquakes. Aiming to serve government or businesses. The model analyze government official records.
The tools used were: ArcGIS Pro, DIVA-GIS records


